You may have read the recent op-ed by Bryant Baker and Dr. Chad Hanson titled “Cutting Through the Misconceptions About Logging and Wildfire” in The Mountain Enterprise. Below are images illustrating some of the points made in that op-ed as well as links to relevant scientific studies.
Much of the piece discussed the 2020 North Complex in the Sierra Nevada. Much can be learned from analysis of this wildfire event.
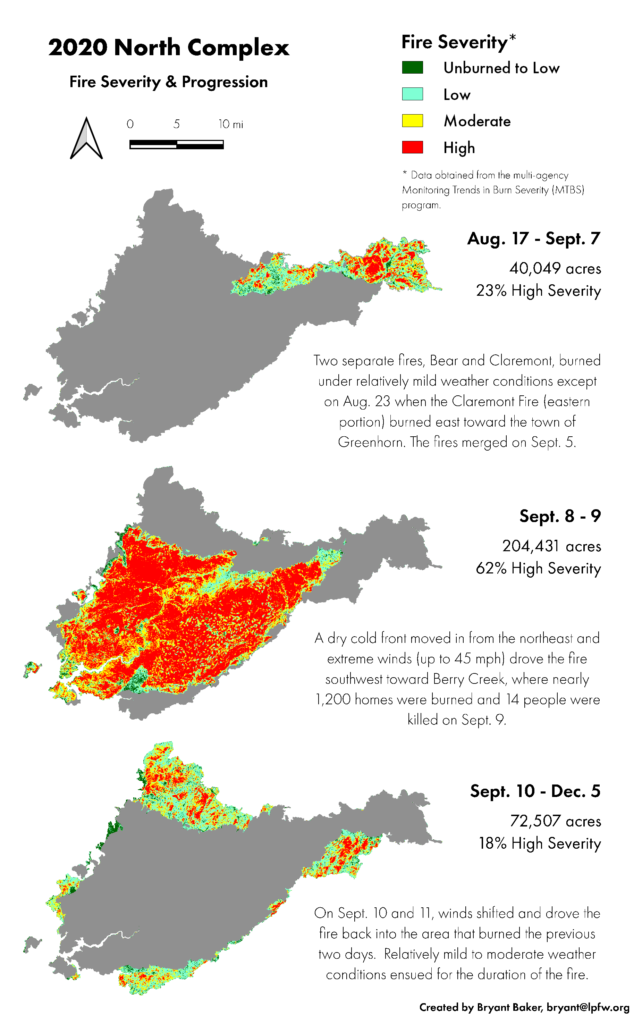
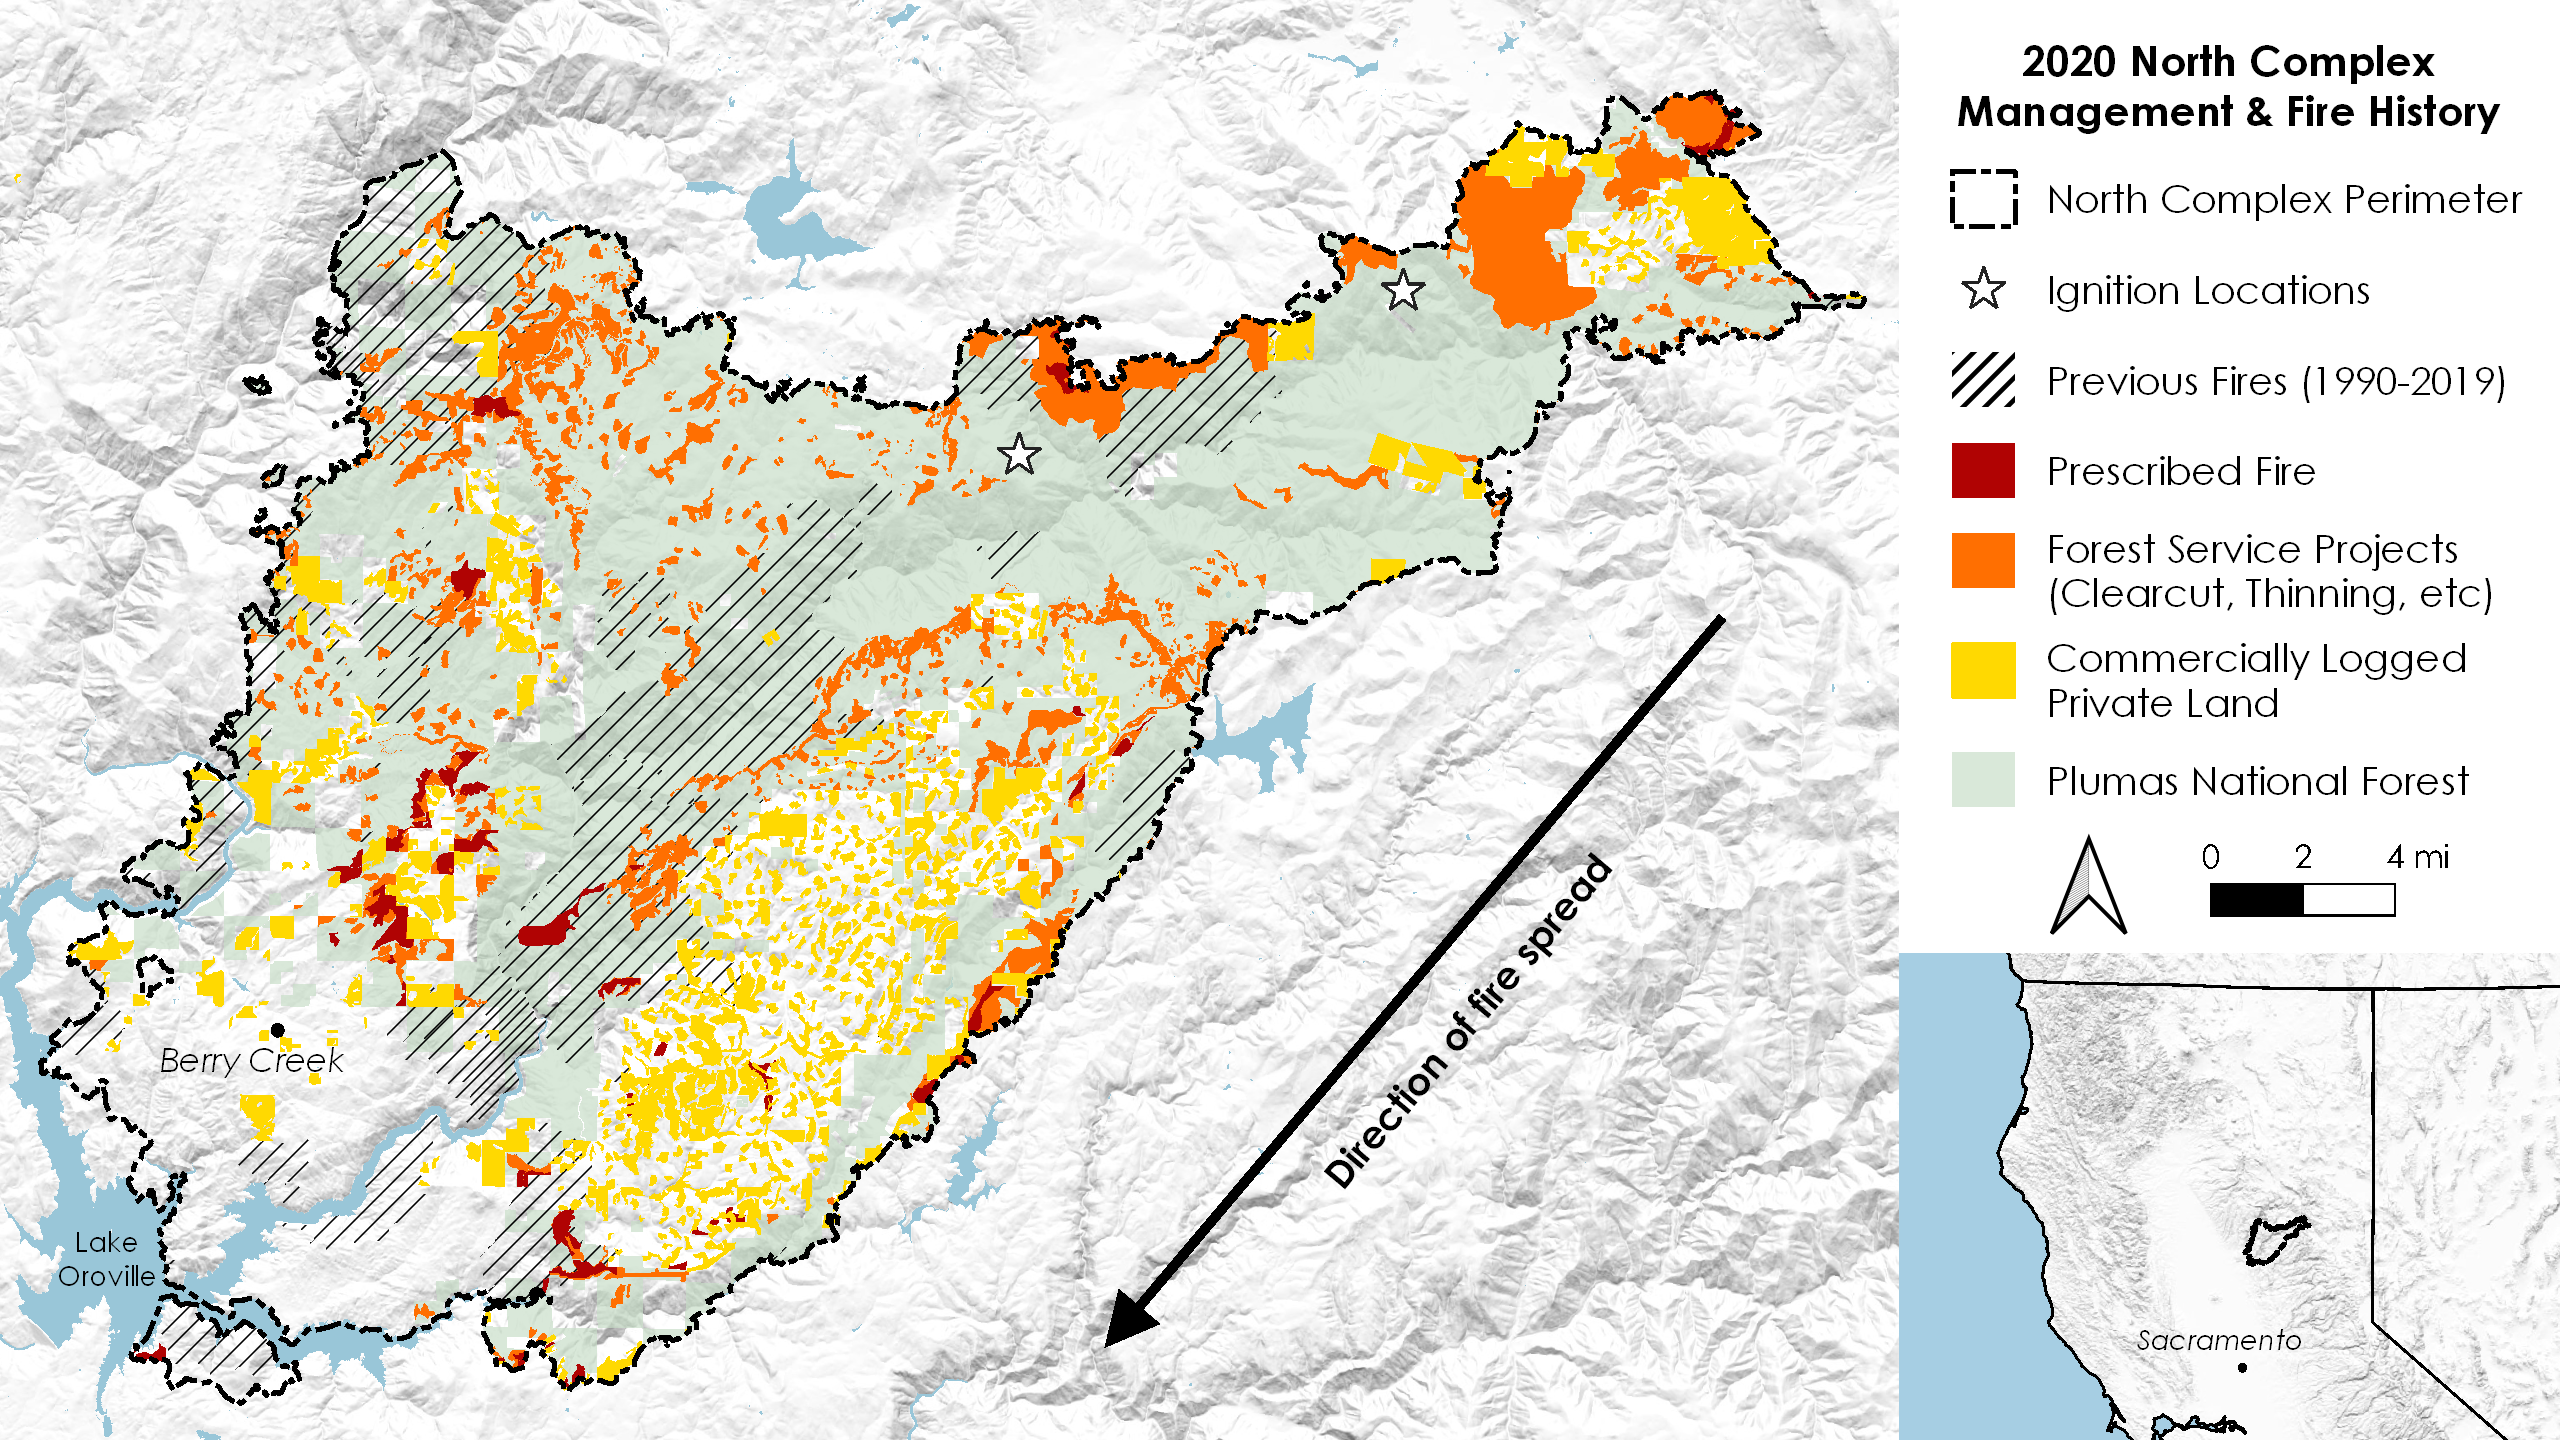
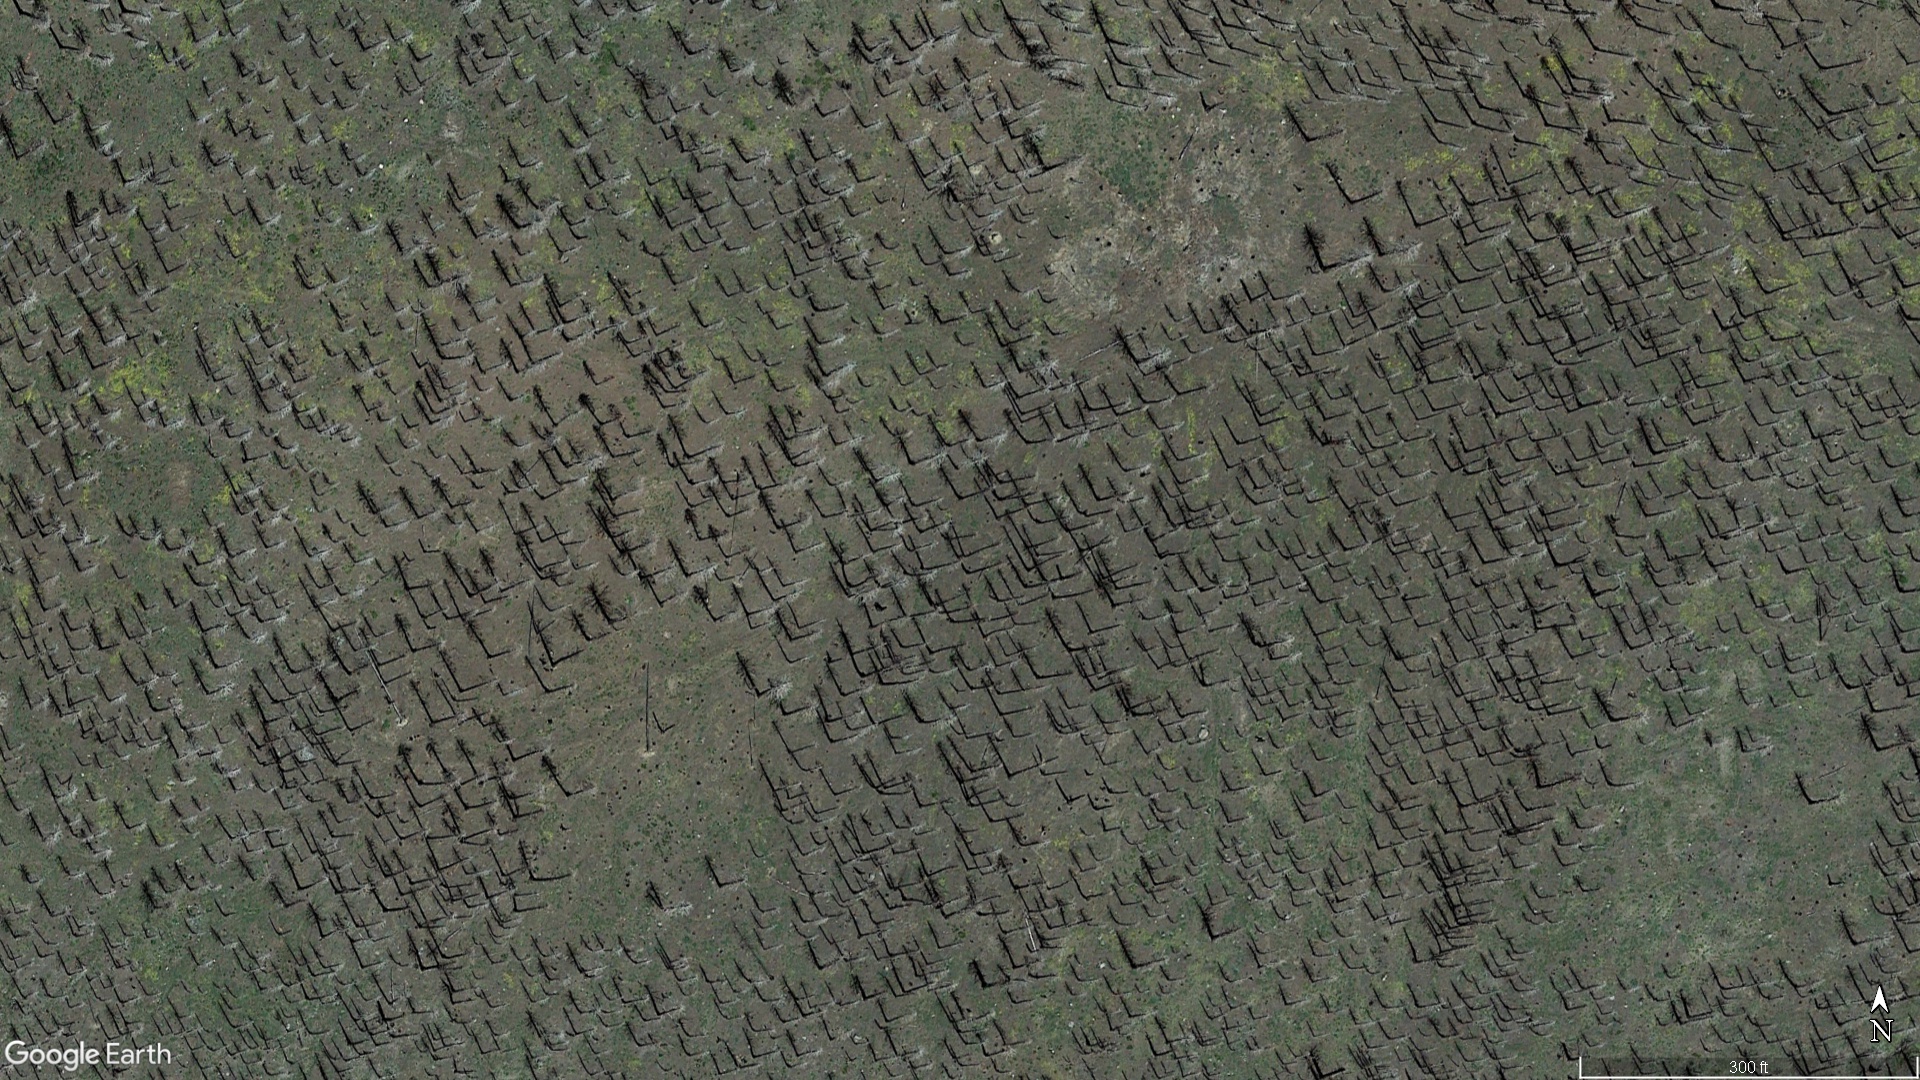
The example in images above is not an exception—many other project areas experienced significant amounts of high severity fire, especially on the day when the fire was driven by extreme winds.
The op-ed also made some key points about carbon dynamics related to logging and wildfire. Logging in the form of thinning, has been found to emit three times as much carbon per unit area than they prevent from being emitted in a subsequent wildfire. This was demonstrated by Campbell et al. in 2012:
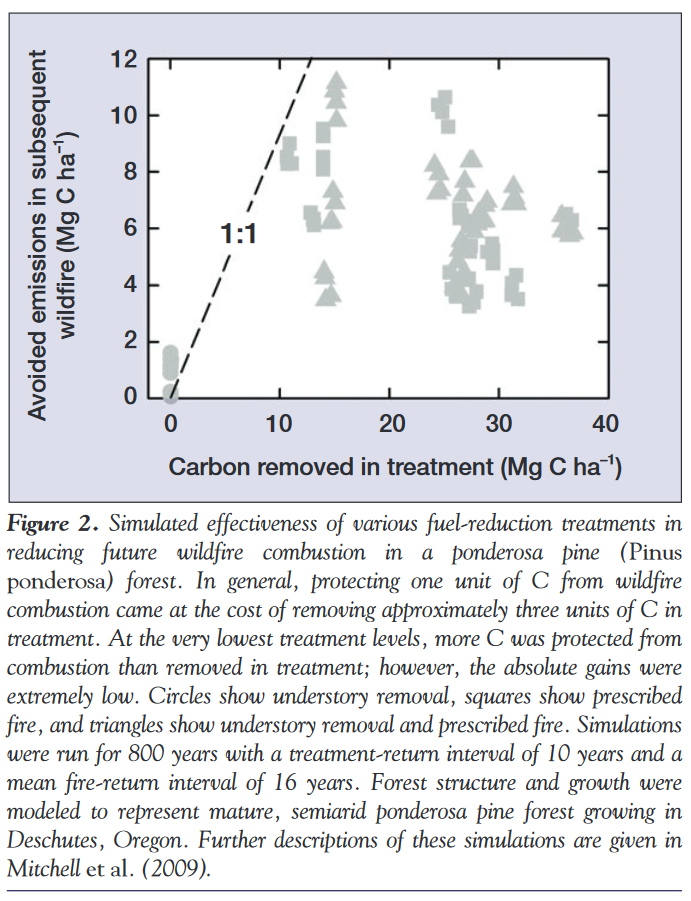
A recent paper published by Bartowitz et al. (2022) made a similar finding:
Our results and the majority of full-carbon accounting studies conclude that any type of harvest (logging or commercial thinning) decreases forest carbon storage (Law et al., 2013), and this research shows harvest emits more carbon per unit area than fire at all scales…
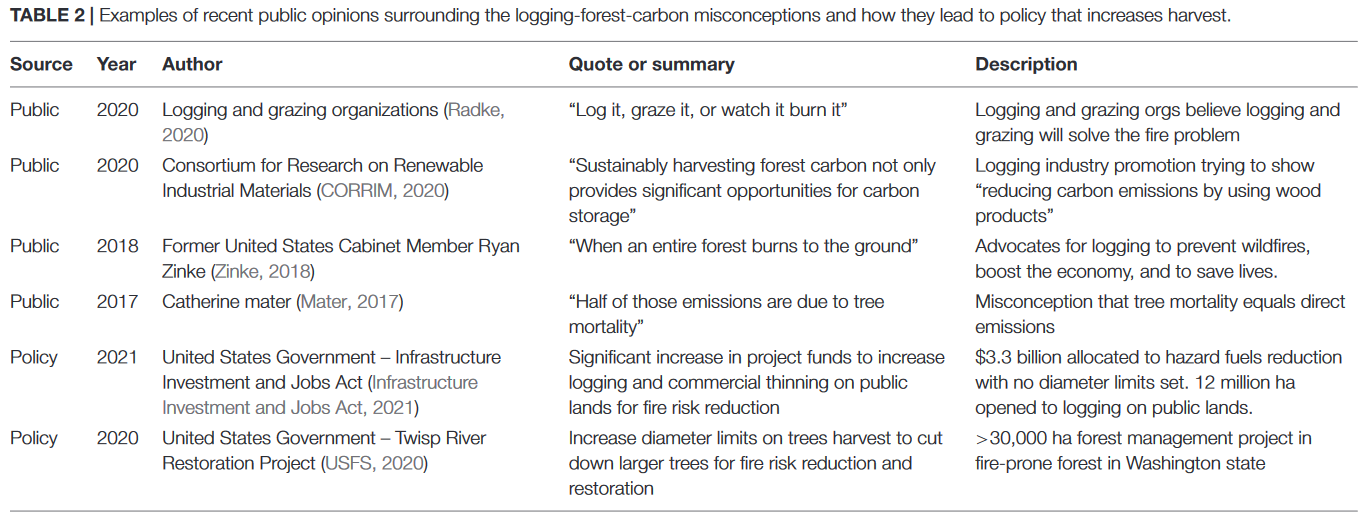
That same paper also has a useful table with examples of recent public discourse and policies that include misconceptions about carbon emissions associated with logging and wildfire.
One particular misconception about carbon and wildfire is the idea that most or all of the carbon in a tree that is killed in a fire will be emitted quickly into the atmosphere. A study by Harmon et al. (2022) analyzed combustion rates in live trees that burned during large forest fires. They concluded:
The end result in the forests we examined is that even very severe fires combust < 2% of live aboveground woody biomass on average….The fact that the vast majority of aboveground woody biomass is not combusted raises the question of when fire-killed trees actually release their carbon. If dead trees are allowed to remain in place, the natural decomposition process could take many decades to centuries to release fire-killed carbon.
Lastly, the op-ed discuss methodological issues with a paper by North et al. (2022) that was featured heavily in The Mountain Enterprise in February. One of the main issues with that paper is that the authors relied on an analysis of 1911 timber inventory data in California that has been shown to underestimate the historical prevalence of small trees as well as the overall density of forests. Baker and Hanson (2017) [note: the study’s lead author was William L. Baker at the University of Wyoming, who is unrelated to Bryant Baker of Los Padres ForestWatch] concluded:
Timber-inventory estimates were documented in early reports and scientific publications, based on accuracy checks, to have large errors, often requiring that estimates be corrected by multiplying them by 2.0–2.5. These large documented corrections are shown here to be supported and widened by empirical 1.4–3.2 correction multipliers needed to make early timber-inventory estimates match nearby or overlapping tree-ring estimates. The need for corrections and the unreliability of estimates were not mentioned or applied in any recent study.
In other words, they found that even the Forest Service knew in the early 1900s that these timber inventories were underestimating forest density and needed to be corrected. Yet, recent studies using these data, including a study by some of the same authors of North et al. 2022, did not apply any correction factors. Baker and Hanson also described inherent biases in the timber inventories themselves, noting that:
Timber inventories are also inherently and intentionally biased, focused on merchantable timber, and often intentionally omit detailed data for areas with younger and smaller trees, shrub fields with tree regeneration, and other areas of preceding high-severity fires.
Perhaps more importantly, Baker and Hanson analyzed data trees less than 12 inches in diameter that were included in the 1911 timber inventories. These historical data on trees less than 12 inches in diameter were not included in previous studies (including by some of the authors of North et al. 2022) that used the 1911 timber inventory datasets. Baker and Hanson found that historical forests in the southern Sierra Nevada had 69 – 87 trees per acre that were less than 12 inches in diameter and thus made up a large proportion of the total number of trees per acre historically. Despite the information provided in Baker and Hanson 2017, as well as further corroboration of that study in a paper published by Baker et al. in 2018, North et al. 2022 still incorrectly used 1911 timber inventory to estimate historical forest density and structure.